Top Ecommerce Metrics To Track: 29 Metrics + Solid Examples
Published On: 27 Mar 2023
By:Lifesight

US ecommerce sales recorded a brilliant $1,034.1 billion in 2022 and yet a third of that wave is taken over by ecommerce giants. To stay ahead in this highly competitive space, it's important for you to track ecommerce metrics and ensure consistent growth across your dashboard for ecommerce. The best way to do that is with an ecommerce dashboard that is automated, allows period tracking of ecommerce key metrics, and works in tandem with your current operations and marketing strategy.
Important Ecommerce Metrics to Track
Here are some top ecommerce metrics to track at each stage of the customer journey:
Awareness Stage
Tracking ecommerce metrics at the awareness stage shows how customers are interacting with your content, how effective your marketing strategies are, and how likely are customers to convert and remain loyal. Accordingly, you can adjust your strategies to better target potential customers and improve profits.
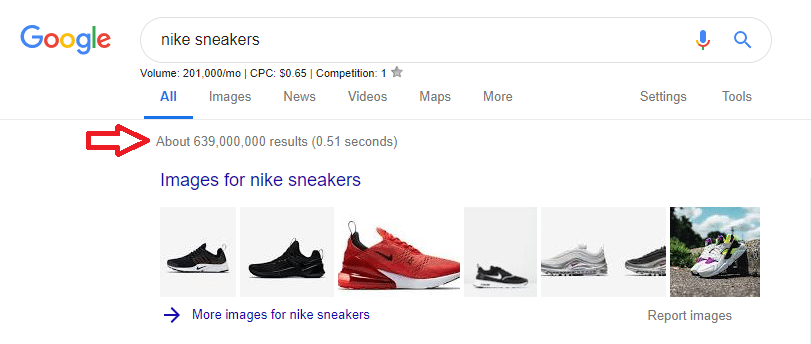
1) Brand Name Search
Ecommerce key metric brand name search measures the number of times a customer searches for a particular brand name across search engines. A high number of brand name searches indicates that the brand is well-known and has a strong presence in the market, while a low number may suggest a need for increased brand awareness efforts.
Tracking with tools like Google AdWords, Google Search Console, and Google Keyword Planner can help you understand how many impressions your brand is gaining.
Example: Nike

Nike has established itself as a household name and a leader in the athletic apparel industry. A search for "Nike" on Google displays the company's official website as the top result, followed by its social media profiles and online stores. Nike also uses Google AdWords to place targeted ads in search results to increase visibility and reach.
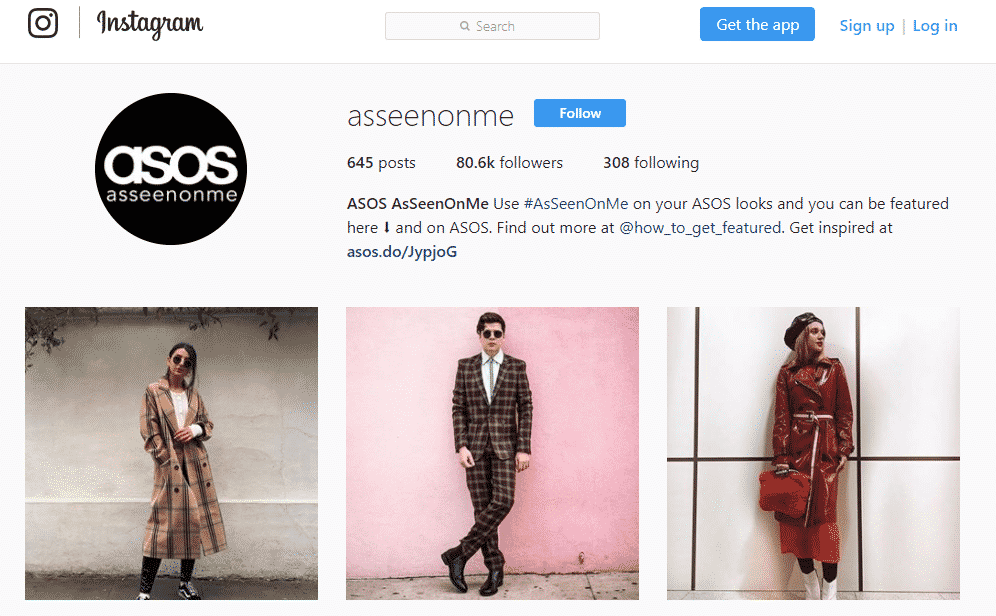
2) Facebook and Instagram Reach
Tracking reach is crucial to growing a brand's social media footprint because it tells you how many people have viewed your post. Since each user is counted only once, it is an accurate measure of the number of people viewing your content.
Use the Facebook Advertising Report to measure insights across an ecommerce KPI spreadsheet and be mindful of impressions, cost per 1K impressions ($), reach, cost per 1K reached ($), and frequency.
Example: ASOS

Fashion brand ASOS is renowned for its creative and engaging campaigns on both Instagram and Facebook where they enjoy an audience of 14.3M and 5,077,294 respectively. They use captivating visuals, strategic reel content, plenty of platform native engagement features (like polls and quizzes), and influencer campaigns to capture the attention of their audiences.
3) Video Reach
Ecommerce metric Video reach refers to the number of people who have viewed a particular video. It can be tracked using YouTube Reports, Vimeo Reports, and Facebook Video Reports. These tools help you keep an account of views (which is a major addition to your ecommerce KPI dashboard) to help you understand your reach and improve your video marketing strategy.
Example: AirBnB (Link to the video)
One brand that effectively utilized video reach is Airbnb with their "Live There" campaign that garnered over 5 million views on YouTube, increasing brand awareness and engagement. The video ad featured people from different parts of the world experiencing the local culture and lifestyle of the places they visited, rather than just being tourists.
4) Search Engine Ad Reach
Search engine ad reach is a measure of how many potential customers are exposed to your brand through search engine advertising. You can track the top Ecommerce metric with Google AdWords on an ecommerce KPI dashboard via search impression share and display impression share.
Example: Amazon

Amazon has nailed its search engine ad reach to reach a massive audience, displaying ads for their products and services on Google search results pages, as well as on Google's display network. Their AdWords campaign has been highly successful in creating awareness and generating sales for their top ecommerce business: in fact, Amazon spent a cumulative $10.8 billion on Google Ads in 2022.
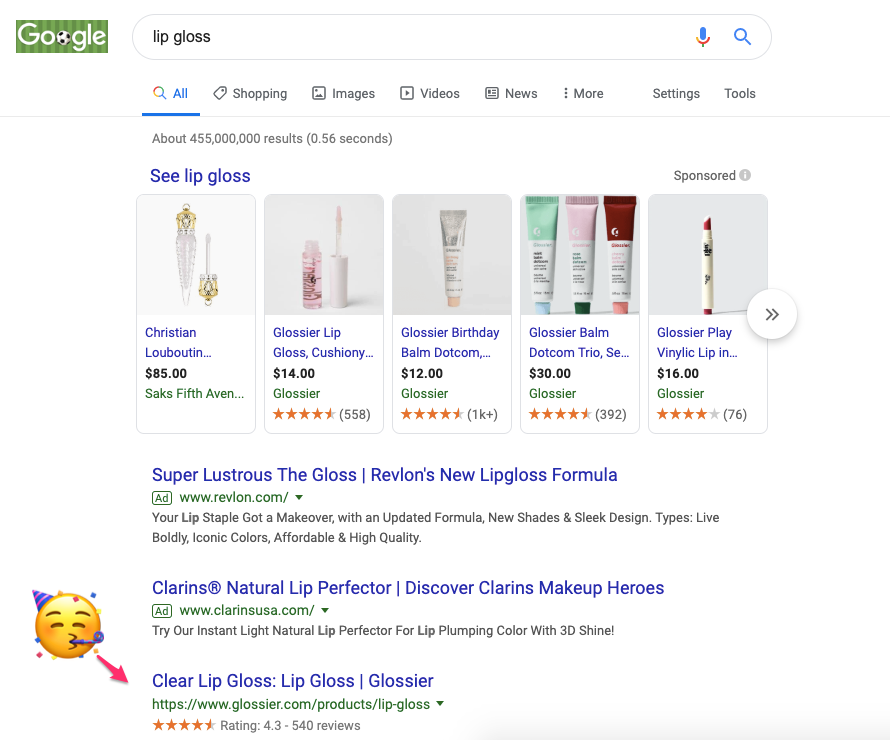
5) Search Engine Results/Reach
Search engine results/reach is a top ecommerce metric that helps with a variety of discovery processes in the ecommerce cycle. It is most commonly optimized with the Google Search Console, which helps track the reach of your website through an ecommerce KPI dashboard that displays total impressions and average position.
Example: Glossier

Glossier has a strong organic search presence bringing in 12,000 monthly visitors by ranking highly for relevant keywords such as lip gloss, highlighter makeup, boy brow, eau da parfum. They also invest in paid search advertising spending as much as $40,700 in 2019. This helps drive traffic to their website, reach new customers and complement organic activity where needed.
6) Guest Blogs on Third-Party Site
Guest blogging involves publishing content on external blogs with a relevant audience to build authoritative backlinks, drive referral traffic, grow an audience, and get more leads. KPIs such as the total and the unique number of monthly readers, as well as the email list size can be used to measure the effectiveness of this tactic.
Example: Xbox

With the audience in an uproar about certain rumors regarding console suspensions, Xbox pursued guest blogging to gain control over the discourse. Stephen Toulouse, head of Xbox LIVE Policy and Enforcement, took to his fellow teammate's popular gaming blog and addressed all discrepancies, paving the way for healthier discussion.
Consideration Stage
In the consideration stage, the customer has become aware of the product or service and is researching and evaluating different options. They may compare features, prices, and reviews of products from top ecommerce brands. This stage is critical as it is where the customer decides whether or not to make a purchase, and it is an opportunity for you to showcase your products and differentiate your brand from competitors.
Let's understand which ecommerce metrics and KPIs to monitor at this stage:
1) Onsite Traffic Behavior
Using ecommerce dashboards in tools like Google Analytics and Lifesight Engage, you can analyze data across sessions, users, pages/session, bounce rate, average session duration, and new users. It will help you determine the onsite traffic behavior of your customers and identify areas for improvement to optimize the website design and content and provide a better user experience.
Example: Warby Parker

Warby Parker tracks onsite traffic behavior using Google Analytics and other ecommerce dashboards. They analyze ecommerce metrics and KPIs through formulas for pageviews, bounce rate, time on site, and conversion rate to gain insights into customer behavior and optimize their website accordingly.
2) Inbound Traffic Sources
By tracking your inbound traffic sources with tools like Google Search Console, you can see which channels are driving the most traffic to your site through clicks, average click-through rates (CTR), and average position. Use this information to focus on the channels that are most effective at driving traffic and improving the ecommerce sales dashboard.
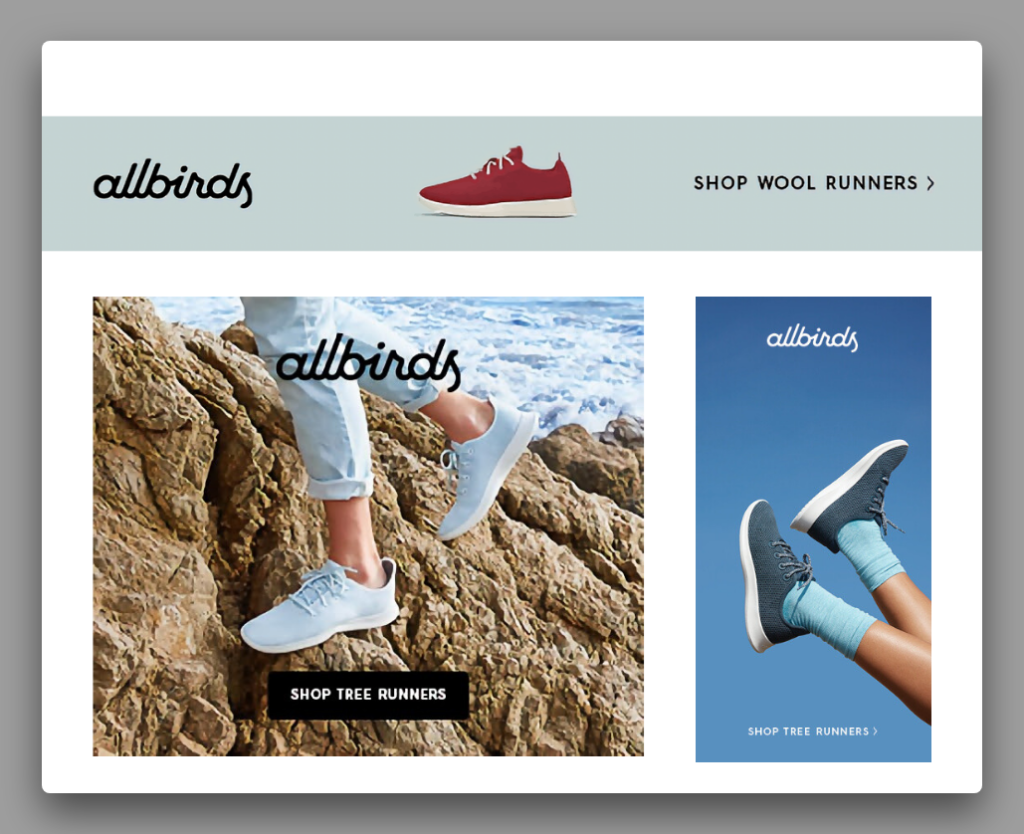
Example: Allbirds

Allbirds tracks inbound traffic sources using tools such as Google Analytics and Mixpanel. They analyze important ecommerce metrics such as traffic volume, bounce rate, and conversion rate to identify which channels are driving the most traffic i.e. 43% search, 40% direct, 6% referrals, 6.6% social, 1% mail, and 2.71% display. Ranking for 452 keywords, 92.57% of their traffic is branded.
3) Email Engagement
By tracking email engagement, you can analyze your subscribers' responses with new subscribers, unsubscribers, open rates, click-through rates, how often they're clicking on the CTA, and who eventually converts. While you can refer to these insights with your current email service provider, Lifesight Engage offers a sophisticated approach that helps you keep a track of the top key performance indicators and mine this data through an ecommerce marketing dashboard.
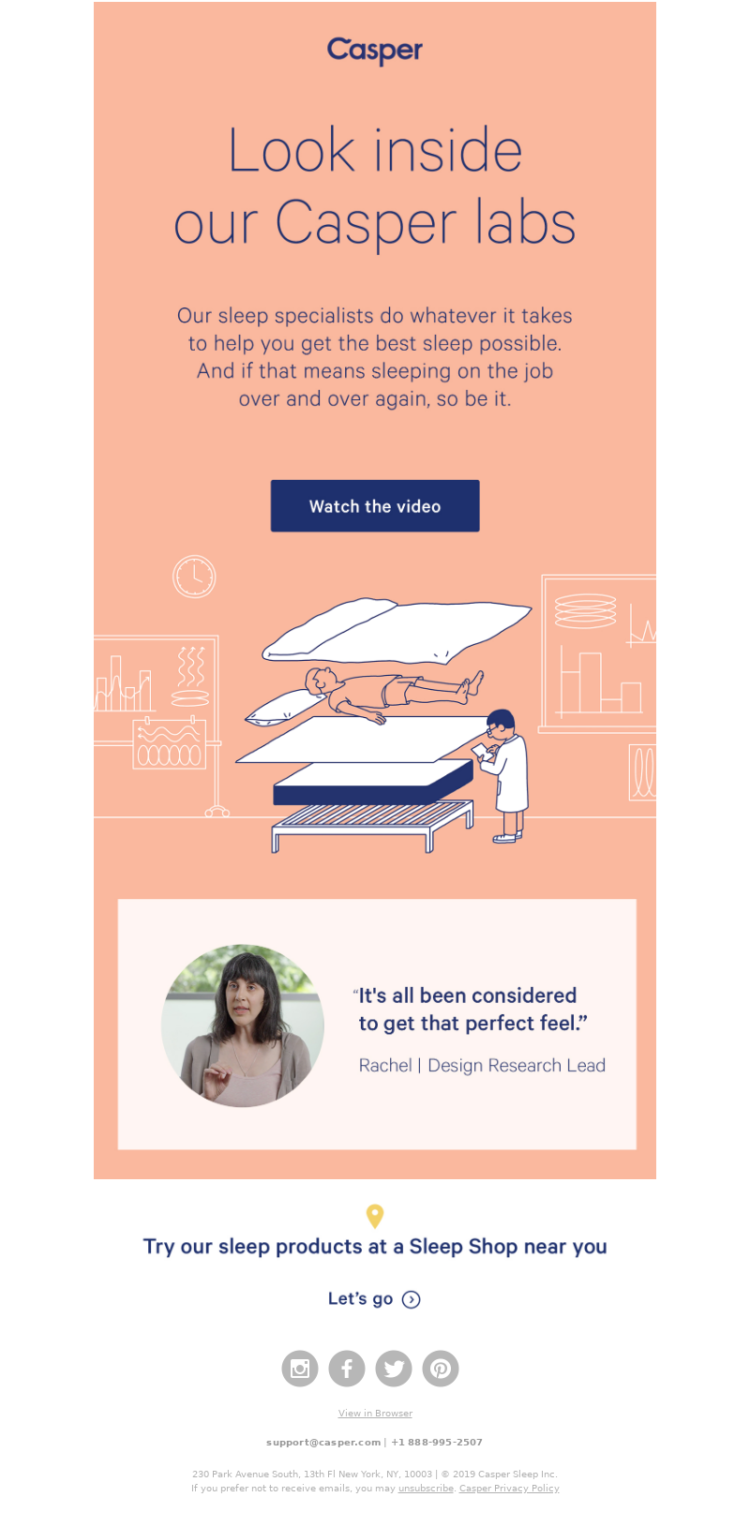
Example: Casper

Casper uses email marketing to engage with customers at every stage of the customer journey, from welcome emails for new subscribers to post-purchase follow-ups and abandoned cart reminders. They also provide helpful content such as sleep tips and advice.
4) Social Media Engagement
By monitoring Facebook, Instagram, Twitter, Pinterest, YouTube, and Reddit, you can determine whether your content is driving conversations and conversions through average likes, shares, retweets, repins, and comments per post. You may want to add these Ecommerce key metrics and KPIs to your ecommerce metrics dashboard.
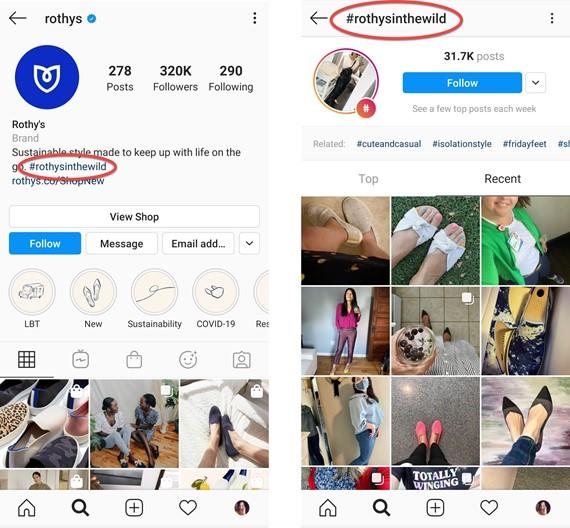
Example: Rothy's

Rothy's uses social media to showcase its sustainable and eco-friendly products. They use Instagram and Pinterest to share user-generated content, highlight their company values, and provide a behind-the-scenes look at their production process while accelerating social commerce with the Shopify store integration. They also tap into community marketing with their close-knit group Rothy's Addicts, driving larger initiatives with word of mouth.
Conversion Stage
This is the ultimate goal of the ecommerce funnel and where you can measure the success of your initiatives across the ecommerce marketing dashboard. During the conversion stage, you want to provide a smooth and easy shopping experience for your customers. This involves having a clear and user-friendly website design, product descriptions that provide all the necessary information, and an intuitive checkout process.
1) Micro-conversion
Micro conversions are small actions that potential customers take on your website that lead to the ultimate goal of making a purchase, with ecommerce metrics and KPIs such as # of Net New Emails Collected, and the # of Samples Ordered. To track micro conversions through Google Analytics, you can set up Goals, which are specific actions that you want potential customers to take on your website.
Example: Brooklinen

Brooklinen tracks micro-conversions such as newsletter sign-ups, product page views, and add-to-cart actions. They use these ecommerce metrics to gain insights into customer behavior and optimize their website and marketing campaigns accordingly.
2) Micro-to-macro conversion
Micro-to-macro conversions are a series of smaller actions that lead to a larger goal, such as making a purchase after a newsletter signup or sample collection. To track micro-to-macro conversions, you can set up conversion funnels in Google Analytics and then track KPIs # of Sales Generated from Net New Emails (# of Sales in same time period ÷ # of net new emails), # of Sales Generated from Samples (# of Sales in same time period ÷ # of samples ordered).
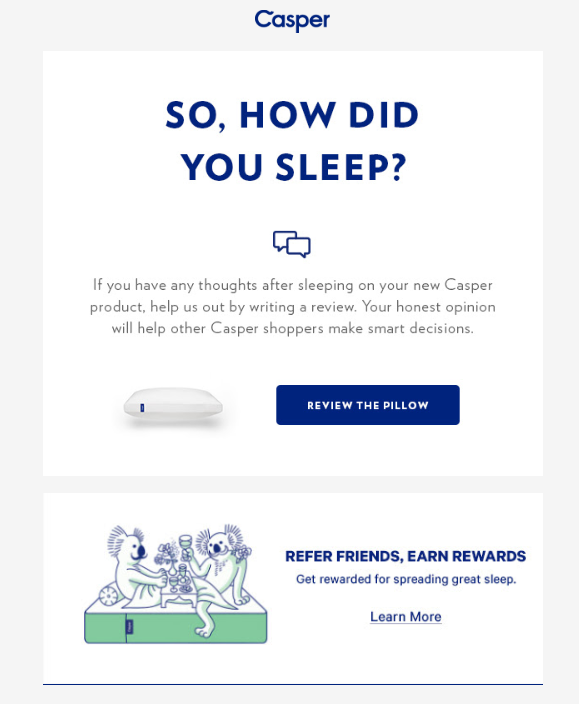
Example: Casper

Casper tracks various micro conversions as its top ecommerce metrics, including website visits, CTRs on ads, social media engagement, and email open rates. They then tally this information with macro conversions such as purchases, revenue, CLV, repeat purchases, and customer retention rates.
3) Transactions
This is where the games at primary goal of any ecommerce business is to improve the # of transactions. Create dashboards for ecommerce in tools like Google Analytics or Shopify Analytics, which provide detailed reports of orders, sales, and revenue.
Example: Dollar Shave Club

A men's grooming brand that offers affordable shaving products and other personal care items, Dollar Shave Club tracks transactions to measure their revenue, AOV (Average Order Value), and customer retention rates.
4) Total Sales
By tracking total sales revenue, you can identify your best-performing products, channels, and campaigns, and optimize your website's user experience. Lifesight offers a plethora of ecommerce dashboard templates for you to make data-driven decisions that improve the bottom line.
Example: Thrive Market

An online marketplace that offers organic and healthy products at wholesale prices, Thrive Market tracks total sales to measure their revenue, sales growth, and customer lifetime value on the ecommerce admin dashboard.
5) Average Order Value
Simply put, Average Order Value (AOV) is the average amount of money spent by customers per transaction. By tracking AOV, you can gain insights into customer behavior and purchase patterns, and optimize your pricing strategies accordingly.
AOV = Total Sales ÷ Total Transactions and use the tools Google Analytics and BigCommerce Analytics.
Example: Peloton

Peloton is a fitness company that offers high-quality exercise equipment, interactive workouts, and personalized coaching. The brand's AOV is around $3,000 due to its premium products, personalized experiences, and exceptional customer service. It also helps that their average product is priced at a higher rate, with expensive equipment and a subscription-based service.
6) Sales Totals Generated by Channel
Dashboards for ecommerce in tools like Google Analytics and BigCommerce Analytics can help you identify which channels drive the most revenue: search engines, email, and social media. With this, you can adjust your marketing strategies accordingly to invest more in high-performing channels, optimize campaigns to drive more sales from underperforming channels or diversify your marketing mix to reach new audiences.
Example: Bombas

Bombas is a sock company that has generated a significant amount of sales through its email marketing campaigns. The brand sends regular newsletters and updates to its subscribers, which has helped to increase brand awareness and drive growth for the ecommerce sales dashboard.
7) Sales Totals Generated by Product Category
The Pareto Principle dictates that 20% of your inventory drives 80% of the revenue. In such a case, it's important to identify the best-selling categories through Google Analytics and BigCommerce Analytics and optimize offerings accordingly. You can look at expanding these product lines or even coupling best-selling products with low-selling products to drive more growth. It's best to use Ecommerce metrics and a performance dashboard to optimize these effects.
Example: Etsy

Online artisan retailer, Etsy has found success in its Handmade and Craft Supplies category. Etsy's Q4 2021 financial results report states that the Handmade and Craft Supplies category generated $762 million in revenue, which represents 68% of the company's total revenue for the quarter.
8) Sales Totals Generated by Promo Code
Promo codes are an integral part of the ecommerce customer journey and there are several different ways to track them on ecommerce KPI dashboards in tools like BigCommerce Analytics or Sales Report: highest growth, high-performing channels, customer segments, and return on investment.
Example: Mejuri

Mejuri uses a platform-segregated approach with its promo codes program, including regular email newsletters and referral marketing, with exclusive promo codes for discounts on their products. They also have limited-time sales and promotions that are advertised on their website and social media channels, triggering FOMO in customers.
9) Sales Conversion Rate by Channel (i.e. AdWords, Facebook, and Organic Traffic)
Tracking sales conversion rates by channel, such as AdWords, Facebook, or organic traffic helps you determine which channels on your ecommerce marketing dashboard are most effective at driving conversions.
You can allocate marketing budgets or make website optimizations by tracking the total # of sales ÷ the total number of sessions to your store.
Example: MVMT

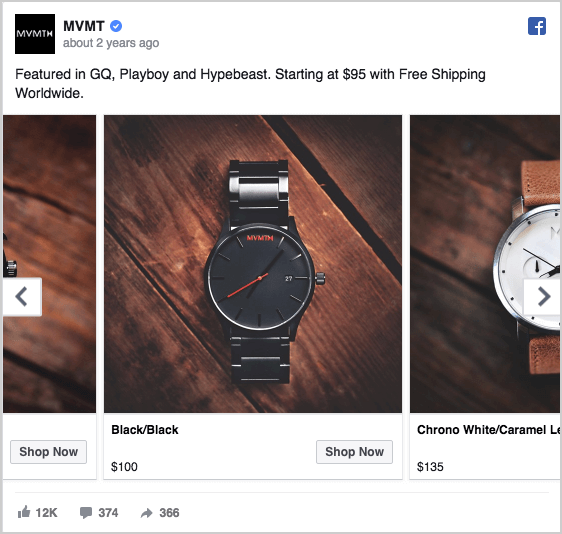
MVMT Watches is a fashion-forward watch brand that targets millennials and Gen Z consumers. The company has used Facebook Ads to target specific demographics and interests with Lookalike Audiences, as well as retargeting website visitors and cart abandoners through dynamic product ads with eye-catching visuals and exclusive promo codes.
10) Sales Conversion Rate by Product Category (i.e. Home Goods, Accessories, etc.)
You can identify the product categories driving the most (and least) growth through Google Analytics or BigCommerce Analytics. You can then look into improving product pages and checkout processes on bestselling categories or optimizing pricing, descriptions, and images on categories that aren't performing as well.
Example: ThirdLove

ThirdLove is a DTC bra and underwear brand that has reported high sales conversion rates for its bras. Known for their commitment to inclusivity and body positivity, they have achieved this with their Fit Finder Quiz, Try Before You Buy program, and inclusive marketing and personalization strategies.
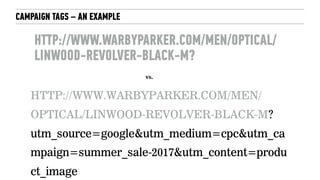
11) Sales Conversion Rate by Campaign (i.e. email nurture, promo code, influencer campaign, etc.)
Using UTM tags to measure, you can track this as the total # of sales ÷ the total number of sessions to your store from the campaign.
Create unique UTM (Urchin Tracking Module) tags for each campaign and add them to the URLs of your campaign landing pages, then track the conversion rate of those URLs in Google Analytics.
Example: Fabletics

Fabletics, an activewear brand, has reported high sales conversion rates from its email nurture campaigns. The company uses ecommerce metrics data and customer behavior insights to personalize its email content and offers, which helps to engage customers and increase the likelihood of making a purchase.
12) Customer Acquisition Cost
Tracking customer acquisition cost (CAC) through Assisted Conversions in Google Analytics can be an invaluable asset. To track this ecommerce key metric, you would first need to set up Goals and Conversion Tracking and then filter by channel or campaign as well as the costs associated with each.
Example: Harry's

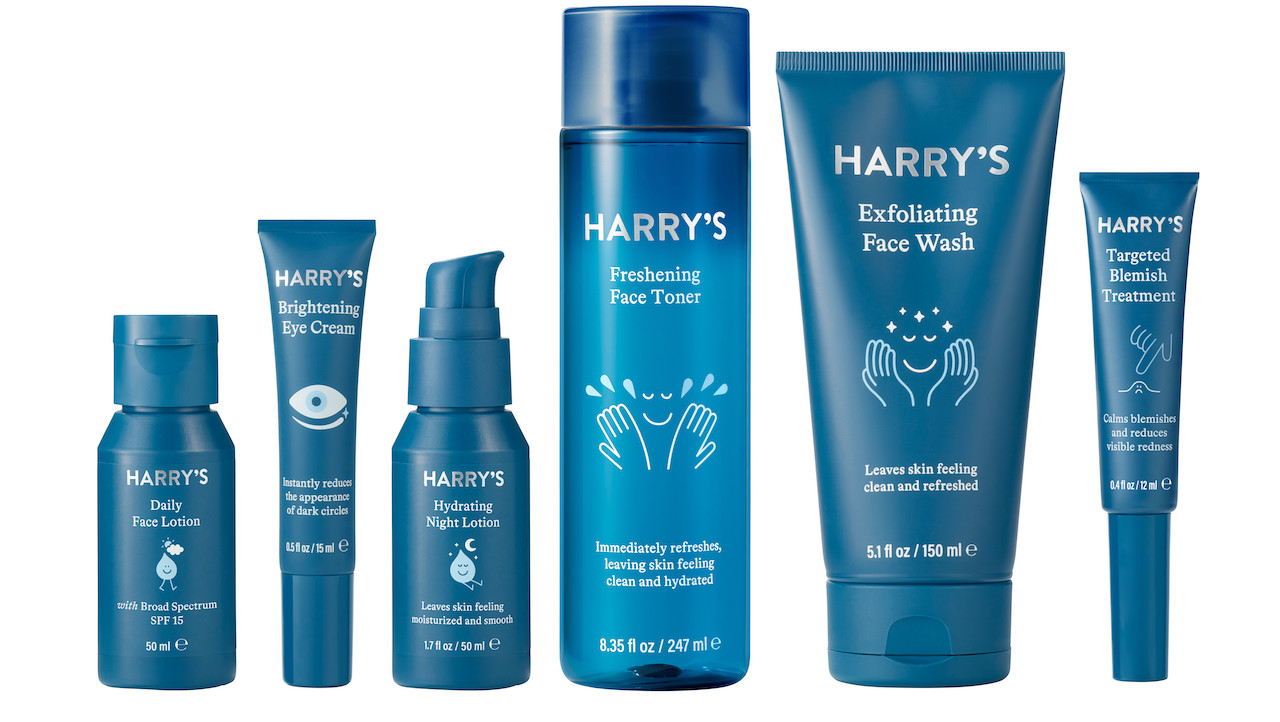
Harry's is a DTC shaving company that has gained a loyal customer base by offering high-quality razors at affordable prices. The company has focused on creating a strong brand identity and building customer trust through transparency and authenticity. Harry's has also used social media and influencer partnerships to reach new customers and increase brand awareness, which has helped to reduce the CAC.
Retention Stage
In the retention stage of the ecommerce consumer journey, the customer has already made a purchase and the focus shifts to retaining them as loyal customers. The goal of the commerce business is to create a long-term relationship with the customers and turn them into brand advocates. By doing so, they can increase customer satisfaction, loyalty, and lifetime value, and also encourage the customer to refer them to their friends and family.
1) Repeat Purchase Rate
Repeat Purchase Rate (RPR) is an ecommerce metric that measures the percentage of customers who have made more than one purchase from a brand within a specified period. To track RPR through Google Analytics, you would need to set up ecommerce tracking and enable RPR (which is automatically generated).
Example: Hims

A men's grooming brand that offers a range of products, from hair loss treatments to skincare, Hims enjoys a repeat purchase rate of around 40%, according to a survey by Second Measure.
2) Purchase Frequency
Purchase frequency measures how often a customer has made a purchase from a brand in the last 12 months. With Google Analytics, you can track this metric over time, segment your customer base based on their purchase frequency, and use this information to tailor your ecommerce marketing dashboard and improve customer retention.
Example: BarkBox

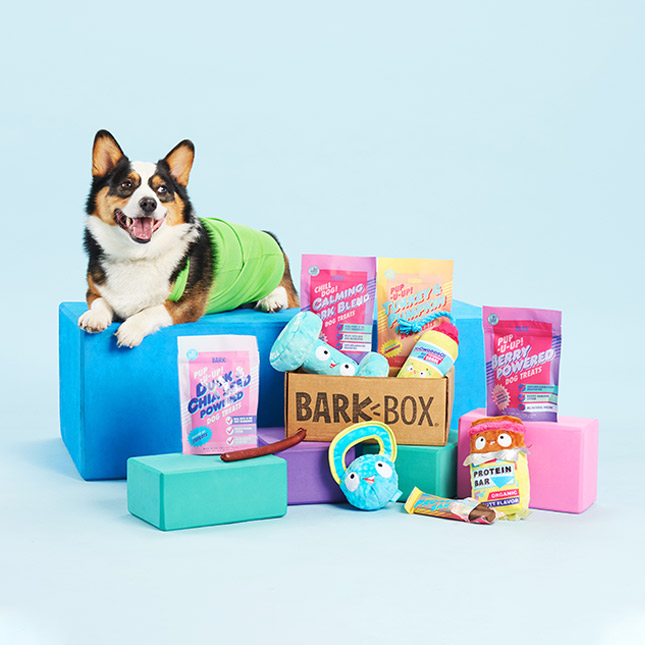
BarkBox is a subscription service that delivers monthly boxes of dog toys and treats to customers' doors. The brand has a high purchase frequency rate with 95% shopper retention because customers need to replenish their dog supplies regularly.
3) Order Gap Analysis
Order gap analysis is a process used by top ecommerce brands to identify gaps or delays in the order fulfillment process. It can be performed using Google Analytics and involves comparing the number of sessions on your website to the number of orders placed.
Ecommerce metric formula for Order Gap Analysis: A simple analysis of 365 ÷ Purchase Frequency.
Example: Away

Away is a DTC luggage brand that tracks order gap analysis to ensure that their suitcases are delivered to customers on time. The company uses data analytics to monitor order fulfillment and identify areas for improvement.
4) Average Customer Lifetime Value
The average customer lifetime value calculates the average revenue that a customer will generate over the course of their relationship with a brand. This Ecommerce KPI can be calculated by dividing the total revenue generated by a customer by the number of purchases they have made.
Example: Stitch Fix

Stitch Fix's focus on personalization, convenience, and data analytics has helped to create a loyal customer base with 103% CAGR that generates significant revenue for the company over time. From the initial customer contact (where customers fill out a detailed questionnaire about their size, style, and preferences) to their regularly scheduled shipments and data-driven insights on the ecommerce sales dashboard, the brand prioritizes the customer experience across the board.
Advocacy Stage
At this stage, the customer is highly satisfied with their experience with your DTC/Ecommerce brand and is willing to recommend the brand to their friends and family. You can encourage this spirit of advocacy by providing exceptional customer service, rewarding loyal customers, and creating a sense of community around your brand. By focusing on advocacy, you can increase your brand reputation and establish your business as a trusted and reliable choice among your target audience.
1) Net Promoter Score
The Net Promoter Score (NPS) is a customer loyalty metric that measures the likelihood of customers recommending a company, product, or service to others on a scale from 0 to 10. Customers are categorized into three groups based on their score: Promoters (9-10), Passives (7-8), and Detractors (0-6). The NPS is calculated by subtracting the percentage of Detractors from the percentage of Promoters, resulting in a score that can range from -100 to 100.
Example: Krave Beauty

Krave Beauty enjoys a high Net Promoter Score with 86/100 on PipeCandy's proprietary Commercepedia maturity scoring model owing to the brand's focus on customer engagement, community building, sustainability, and personalized approach to products and services. They have built strong relationships with their customers and have a loyal following that is likely to recommend the brand to others.
2) Product Reviews (Total)
Tracking product reviews can provide valuable insights into the performance of your products and the overall satisfaction of your customers. Yotpo allows you to segment this metric monthly, enabling you to track the total number of product reviews received over a specific time period, helping you identify trends, respond to customer feedback, and enhance customer experience.
Example: Blueland


Blueland offers effective and high-quality cleaning tablets that customers can dissolve in water to create their own cleaning solutions, which reduces waste and the need for single-use plastic bottles. Customers appreciate the brand's commitment to sustainability, safe and non-toxic ingredients, and convenience of use.
3) Product Reviews (By Channel, i.e. Amazon, Facebook, and third-party websites)
By monitoring reviews on specific ecommerce seller dashboards such as Amazon, Facebook, or other third-party websites, you can gain valuable insights into the sentiment of your customers and identify any common issues or concerns that may be impacting the overall customer experience. It is recommended that you segment and track these ecommerce metrics monthly and periodically.
Example: LEEVAN

LEEVAN monitors product reviews across multiple channels, such as Amazon, Facebook, and other ecommerce performance dashboards, to gather feedback from customers about their products. They also engage with customers through these channels, responding to questions and concerns promptly and proactively, to ensure that their customers have a positive experience with the entire brand.
Final words
Numbers make the game in the ecommerce world and these ecommerce metrics will help you ensure that they're always in your favor. By tracking these 29 ecommerce metrics across the customer journey, you can understand how customers interact with your website, identify pain points or areas where the user experience can be improved, and optimize the customer journey to increase conversion rates, and ultimately drive revenue growth by providing a better customer experience.
Want to track the most important ecommerce metrics and KPI for your DTC/Ecommerce brand?
Sign up for Lifesight and get a free ecommerce dashboard demo today.
Get access to ecommerce dashboard examples and templates that will help you track popular ecommerce metrics, analyze your business growth, and implement solutions that drive profitability.
Related Blogs
Growth Unveiled
Interviews, tips, guides, industry best practices, and news.

Key Strategies to Optimize Your E-commerce Digital Ad Campaign
Top strategies to optimize eCommerce digital ad campaigns and boost ROI with expert insights on targeting, creatives, an...

4 Ways Modern Marketers Can Start Their AI Journey
Discover the transformative power of AI in marketing with Lifesight's comprehensive guide. Explore data enrichment, cont...
Key Strategies to Optimize Your Digital Ad Campaign
Top strategies to optimize digital ad campaigns and boost ROI with expert insights on targeting, creatives, and analytic...
Future-proof your marketing measurements
Forecast accurately with no-code ML & AI model setup that provides comprehensive predictive insights
Stay in the know with always-on measurements providing real-time channel performance
