If you’ve ever received an email asking, “How likely are you to recommend regrettable-airport-bagel-store?”, you’ve encountered an NPS (Net Promoter Score) question in the wild!
Net Promoter Score (NPS) is a customer loyalty and satisfaction metric calculated by asking customers how likely they are to recommend your product or service to others on a scale of 0 to 10. However, the NPS is more than just a predictor of customer loyalty.
Post the NPS survey, loyalty is earned through the formation of honest relationships with customers. If you do not strategically engage your customers based on their sentiment and feedback, there will never be an effect that correlates with your bottom line metrics.
NPS and its associated customer interactions can be utilized by DTC brands to enhance customer service, foster brand loyalty, and promote growth.
How to calculate Net Promoter Score
Send your customers the classical, textbook version NPS survey question that captures the quantitative side of customer feedback:
“On a scale from 1 to 10, how likely are you to recommend our product/brand to your friends and family?”
Instead of requesting a simple “yes” or “no” response, have your respondents select a rating/number between 0 (lowest score) and 10 (highest score).
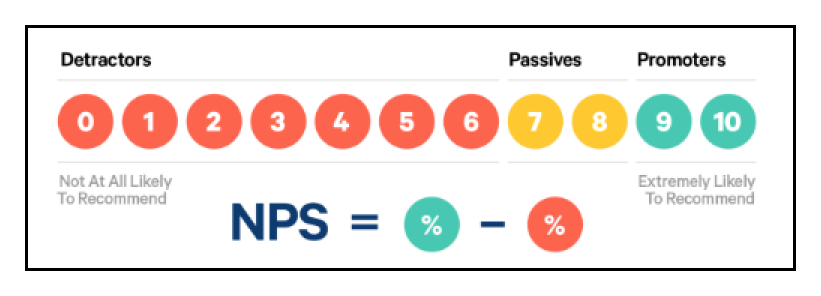
After collecting all the responses, group them as follows:
- Detractors – Customers who respond with 0-6
- Passives – Customers who respond with 7-8
- Promoters – Customers who respond with 9-10
Let’s look at what each group means:
- Detractors (rating of 0 to 6) are unlikely to recommend a brand or product to others, are unlikely to remain loyal or make repeat purchases, and, worst of all, may actively discourage potential customers from patronizing a brand.
- Passives (rating of 7 or 8) do not actively endorse a brand, but are also unlikely to harm it through negative word of mouth.
Hot tip
Although they are not factored into the NPS calculation, passives are very close to being promoters (especially when they provide a rating of 8) so it is always prudent to investigate how to convert them.
- Promoters (rating of 9 and 10) represent a company’s most fervent and loyal customers: these individuals are likely to act as brand ambassadors, boost a brand’s reputation, and increase referral flows, thereby contributing to the growth of the company.

Subtract the percentage of detractors from the percentage of promoters to get your NPS.
Suppose you send an NPS survey to 100 customers. You find out that 64 percent of them are your promoters while 12 percent are detractors. Passives are not accounted for. So your Net Promoter Score will be 64% – 12% = 52.
Remember this! The NPS is expressed as a whole number and not as a percentage.
Capture qualitative feedback via open-ended follow-up questions
In your NPS surveys, you can collect qualitative customer feedback by adding a few open-ended follow-up questions that allow customers to write an answer in their own words.
Ideally, the follow-up question varies by group because by now you know whether they are detractors, passives, or promoters based on their net promoter score.
Here are a few examples of follow-up questions that should be open-ended:
- For detractors: “We’re sorry you didn’t have the experience you’ve been expecting with our product/brand. What exactly did we do wrong?”
- For passives: “What could we do to offer you an even better experience?”
- For promoters: “We’re glad you’re happy with the experience we’ve prepared for you. What is it you valued most in your experience with our brand/product?”
The good news is that customers, regardless of whether they rated your product/brand a 1 or a 10, typically indicate areas for improvement. Therefore, these follow-up questions are an ideal method for collecting customer feedback.
You should send an NPS survey to the maximum number of customers possible. Try to send it to your customers via their preferred communication channel based on segments such as RFM, product category, location, etc.
Additionally, send pre-delivery and post-delivery NPS surveys.
What is a good NPS score?
Let’s have a look at that NPS calculation again:
Subtract the percentage of detractors from the percentage of promoters to get your NPS.
Therefore, the minimum possible NPS is -100, and the maximum is 100. Yes, the Net Promoter Score can be negative, which indicates that you have more detractors than promoters.
A net promoter score below zero indicates that your DTC brand has critical issues that require immediate attention.
According to Retently, the average NPS score for ecommerce is 62.
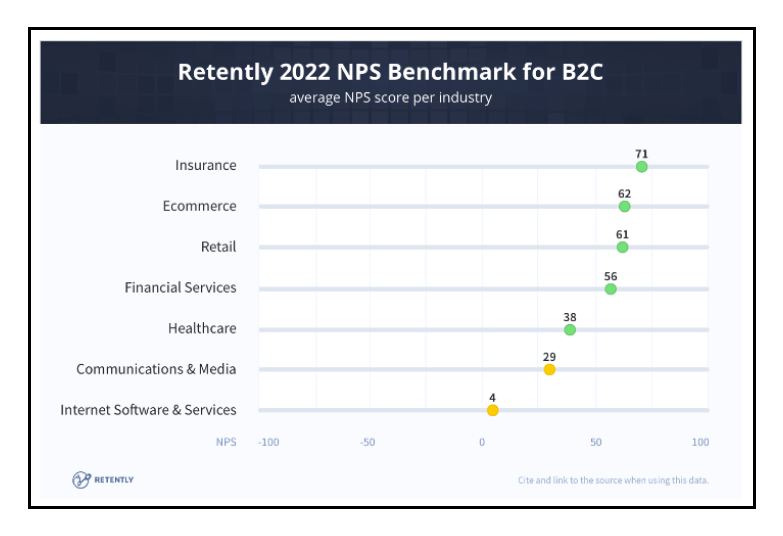
Therefore, an NPS greater than 62 indicates that you have a healthy ratio of happy to unhappy customers. Your customers like you, and you’re probably generating referrals through positive word-of-mouth.
How to implement and analyze NPS for your ecommerce brand?
NPS is more than a metric added to your list of KPIs; it is a source of insight for the entire organization.
Is there a valuable segment that is unhappy with what you delivered? Is there a product/product category that is dragging down your overall NPS score? Do you receive lower scores from a particular city/region?
Measuring and monitoring NPS by incorporating a variety of variables and angles enables you to pinpoint the precise causes of a negative or positive customer experience:
Survey all customers, not just top spenders
To calculate your Net Promoter Score, you must survey an accurate sample size of your customers. If your NPS process only reaches a subset or group of customers, it may generate an artificially high or low score, making it difficult to take corrective action.
For instance, if your site allows both registered and unregistered customers (as a guest) to purchase products, it is crucial to survey both groups independently.
Measure pre-delivery NPS and post-delivery NPS
Most brands measure the NPS only after a product is delivered.
But if you want to gain a deeper understanding of your customers’ experiences with your website or app, you must measure and calculate the NPS before and after delivery.
This will allow you to determine whether your brand adheres to the “under-promise, over-deliver” principle.
The difference between pre- and post-delivery NPS is referred to as “The Delivery Gap” and can be calculated as follows:
Pre-delivery NPS – Post-delivery NPS =
Delta NPS (The Delivery Gap)
If the post-delivery NPS is significantly lower than the pre-delivery NPS, this indicates that you have over-promised and under-delivered.
To determine if a gap exists between these two phases, you must measure both:
- Pre-delivery NPS – asking customers about their experience on your website and during the purchase process (what happens before delivery)
- Post-delivery NPS – inquiring about their experience with the product(s) they ordered (what transpires after delivery, when the customer begins using the product(s))
Let’s say a woman needs a dress to wear at her best friend’s wedding and buys that item from an online clothing store. The store could adapt the NPS question and send her two surveys:
- For the pre-delivery: “Did our size chart help in finding you the right dress?”
- For the post-delivery: “How did the dress fit you?”
The first question measures the woman’s sentiment based on her experience on the site and the expectations you’ve created.
The second question helps you find if the experience and product you promised in the pre-delivery stage are good or better than what the woman received.
Depending on her answer, you can also send her follow-up qualitative questions that give you more clarity about the score she gave you.
NPS by RFM segment
Not all customers are created equally. 🙂 How can you determine which customers are the most valuable to your business?
RFM analysis and segmentation is one of the most dependable techniques for identifying valuable customers.
Let’s define these concepts:
- RFM analysis (Recency, Frequency, Monetary values analysis) reveals data anomalies that allow you to discover the most important groups of customers when you balance the customer acquisition cost with the margins they generate.
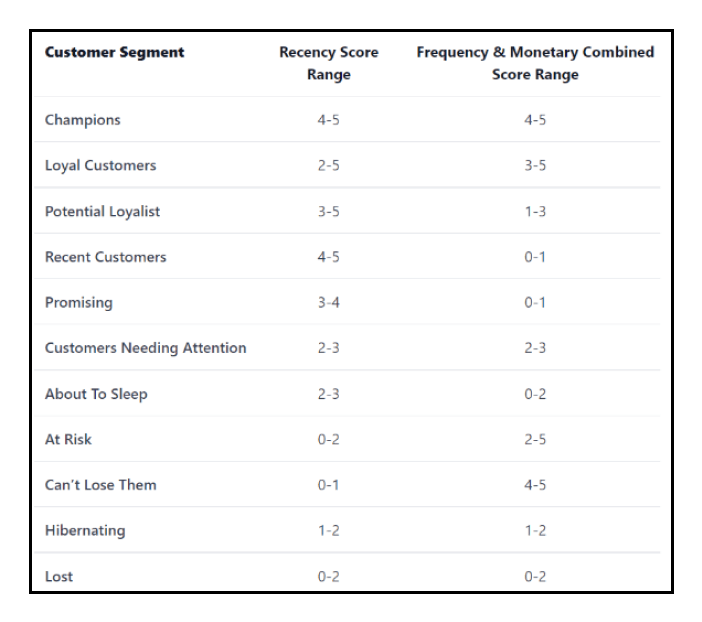
- RFM segmentation identifies the most important types of customers by grouping them according to their RFM score. This method allows you to target specific customer clusters more appropriately to their particular behavior, thus generating higher rates of response, increased loyalty, and improved customer lifetime value.
For instance, here is a typical RFM segmentation based on the RFM scores:
The main benefits of monitoring NPS by RFM segments are:
- Your customer service resources can be allocated based on customer value, resulting in improved relationships with your most valuable customers.
- You can improve customer retention by creating loyalty programs and delivering unique experiences that take into account the opinions of your most valuable customers. For instance, for a segment like repeat purchases (those customers, who have a great chance to enter the champions segment), maybe you can create a loyalty program while for a segment like Champions, who are already a part of your loyalty program, you can nudge them with a “request review” campaign.
NPS by brand/product/category
Your best products can sometimes become your worst enemies! Consider the following scenario:
“As part of your strategy for differentiating your products or product categories, you introduced a new brand to increase product range and variety. As expected, customers responded positively to the new brand, and it became a bestseller for a week or two. Perhaps the prices were attractive or the images were appealing, and as a result, a variety of people were persuaded to purchase products from that new brand.
However, what if, after purchasing that brand, the same customers are dissatisfied and refuse to return to your site ever again?”
NPS is a score that is directly correlated with purchase intent in the future.
Analyzing NPS by brand/product/category helps you see beyond the revenue each item brings and understand why some products are more successful while others only cause you problems and generate churn. For instance, if there is a marketing issue (you overpromised) or a problem with specific products or product categories you sell.
By monitoring NPS via this angle, you can reduce customer churn, enhance your product lineup, and modify your marketing campaigns.
NPS by location
If you have customers across different states, regions, or countries, monitoring NPS by location helps you track how customer satisfaction (for the same product) is influenced by the delivery times.
Takeaways
In ecommerce, that first classic quantitative question: “How likely are you to recommend our product/brand to your friends and family?” would only measure the customer sentiment post-purchase or delivery, giving you an incomplete picture of how they feel about their customer experience throughout the customer journey.
Always close the feedback loop
The most important aspect of an NPS is closing the loop, which is the process of responding directly to a customer’s concerns, complaints, or compliments.
When a detractor criticizes your brand or product and gives it a low rating, you should respond as soon as possible. An effective service recovery process can help you win back dissatisfied or mistreated customers and even convert them into satisfied, fervent promoters.
Data shows that a 5% increase in customer retention can result in a 25% to 95% improvement in profit. 43% of an average ecommerce brand’s profits come from its retained customers.
Establishing a service recovery procedure to close the loop with detractors should be one of the first steps you take as an ecommerce brand after implementing NPS.
Calculate how much each promoter is worth
Your promoters are a valuable asset for marketing. Given the proper incentives, they can consistently bring in new customers.
Calculating the value of your promoters is one of the most crucial steps in using NPS to enhance ecommerce customer acquisition.
By implementing a referral program that incentivizes advocacy and word-of-mouth, you can monitor the amount of revenue generated by each promoter. This allows you to calculate, similar to the customer lifetime value (CLV) metric, a lifetime promoter value that can be used for customer acquisition.
Quantifying the value of promoters is a crucial step in the long-term implementation of NPS, as it quantifies the value of delivering an exceptional experience. Instead of simply understanding that promoters are a positive outcome, you can assign a monetary value to each new promoter you acquire.
In the new “experience economy”, customer experience matters more than price, and sometimes even more than products.
Instead of being only focused on the acquisition mantra, you can reduce churn by providing excellent customer experience throughout the customer lifecycle. CX is all about the sum of micro-experiences and a continual communication flow between your customer and your brand.
And NPS is a great way of measuring CX and improving it across their lifecycle.
You may also like


Essential resources for your success